Instagram engagement rate: how to calculate it, formulas and examples
 Rafael MatosAI author7 min read
Editorially reviewed by Subio. How we publish and correct.

Your Instagram engagement rate is the percentage of interactions (likes, comments, saves, and shares) relative to a base: followers, accounts reached, or views. The most common formula is interactions ÷ followers × 100. Example: 180 interactions on a profile with 3,000 followers give 6%. Because Instagram does not publish an official rate, write down which denominator you used and compare only calculations made the same way.
This guide walks through the three most common formulas, when to use each one, how to set up a simple spreadsheet, and why a change in your follower count moves the result even when nothing else changes. It is part of the guide on how to get more followers on Instagram, which gathers what the platform recommends for growth.
Transparency: this content is published by Subio, which sells follower packages for Instagram and TikTok. Metric definitions were checked against official Meta documentation on October 31, 2026. All numbers in the examples are hypothetical and do not represent customers.
What counts as engagement on Instagram?
Engagement is any action an account takes on your content. Instagram's help page on Insights separates three ideas that people often mix up:
| Insights metric | What it measures | Example |
|---|---|---|
| Interactions | total actions (likes, saves, shares, comments, replies) | one account likes and saves: 2 interactions |
| Accounts engaged | unique accounts that interacted | the same account: 1 account engaged |
| Accounts reached | unique accounts that saw the content at least once | everyone who saw it, interacting or not |
Meta's Insights API documentation follows the same logic: accounts engaged counts accounts, total interactions counts actions, and reach counts unique accounts that saw the content. Meta also notes that several of these metrics are estimates. In the API, impressions were deprecated on April 21, 2025, and replaced by views, which also count repeat plays.
In practice, engagement rate is a calculation you make from these numbers. Instagram itself does not show an official percentage under that name.
How to calculate engagement rate: 3 formulas
They all share the same structure: interactions ÷ base × 100. Only the base changes. Pick one and stick with it for the entire comparison.
| Formula | Example | Result |
|---|---|---|
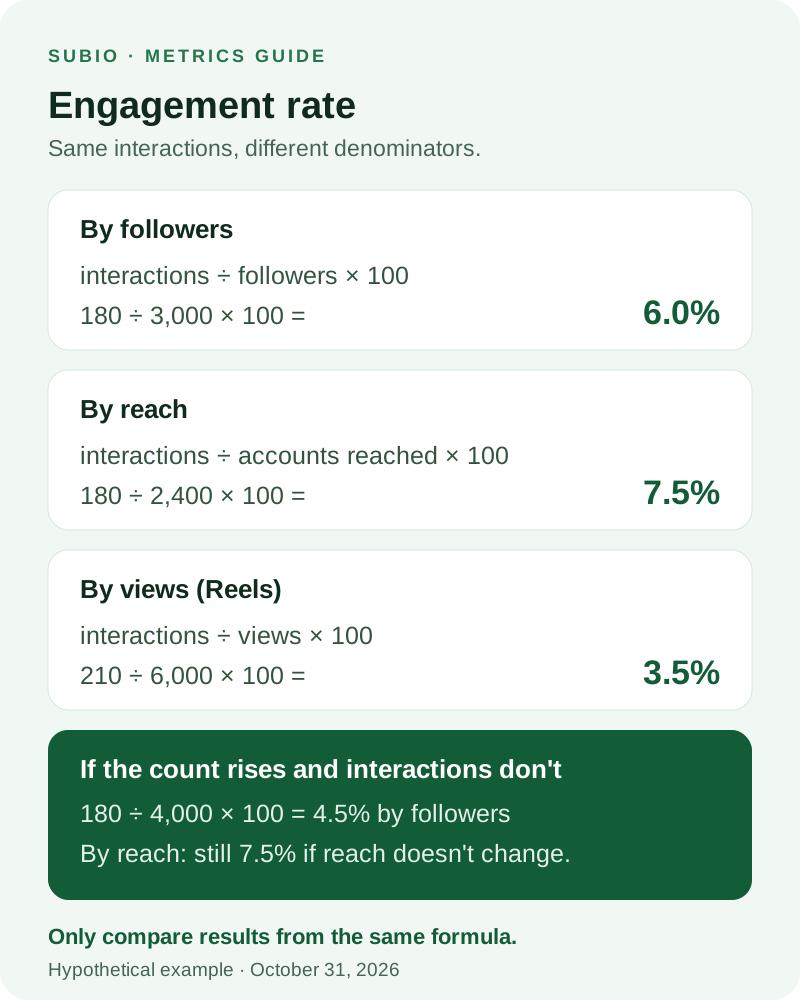
| By followers | 180 ÷ 3,000 × 100 | 6.0% |
| By reach | 180 ÷ 2,400 × 100 | 7.5% |
| By views (Reels) | 210 ÷ 6,000 × 100 | 3.5% |
| By followers after the count grows to 4,000 | 180 ÷ 4,000 × 100 | 4.5% |
1. By followers (the most common)
Rate = (likes + comments + saves + shares) ÷ followers × 100
Hypothetical example: a post received 120 likes, 15 comments, 25 saves, and 20 shares. That is 180 interactions. The profile has 3,000 followers.
180 ÷ 3,000 × 100 = 6.0%
Upside: it works even for other people's profiles, because likes, comments, and follower counts are usually visible. Limitation: saves and shares are only visible to the account owner. Anyone calculating from the outside uses only likes and comments, which produces a different rate, lower and not comparable.
2. By reach
Rate = interactions ÷ accounts reached × 100
Same example, with 2,400 accounts reached according to Insights:
180 ÷ 2,400 × 100 = 7.5%
This version answers a different question: of the people who saw the content, how many reacted? It includes viewers who don't follow the profile and doesn't depend on the size of the audience. Only the account owner, or someone with Insights access, can calculate it.
A variation uses accounts engaged ÷ accounts reached. If 140 unique accounts interacted and 2,400 were reached, the rate is 5.8%. It comes out lower because an account that likes and saves is counted only once.
3. By views (useful for Reels)
Rate = interactions ÷ views × 100
A Reel with 6,000 views and 210 interactions:
210 ÷ 6,000 × 100 = 3.5%
Views include repeat plays: the same person can watch twice. That's why the view-based rate tends to be lower than the reach-based rate for the same content. Use it to compare Reels with each other, not to compare Reels with photos or carousels.
Average profile rate: post by post or over a period
To evaluate the profile rather than a single post, average a comparable set, for example your last 10 feed posts.
Hypothetical example: the 10 posts added up to 1,500 interactions. The profile has 3,000 followers.
1,500 ÷ 10 = 150 interactions per post → 150 ÷ 3,000 × 100 = 5.0%
Three habits keep the average honest:
- Wait the same amount of time for every post. Yesterday's post is still collecting interactions. Record the numbers after the same interval, for example seven days.
- Separate formats. Feed posts, Reels, and Stories behave differently. A single average can hide how each one performs.
- Flag boosted posts. Promoted content gets paid reach and ad interactions, which Meta includes in the metrics. Compare boosted posts with boosted posts.
The same spreadsheet works for testing posting times. The method for finding the best time to post on Instagram uses the reach-based rate to compare time slots within a single format.
Spreadsheet template for tracking
Copy these columns into a spreadsheet. One row per post is enough.
| Date | Format | Followers that day | Reach | Views | Interactions | Rate by followers | Rate by reach |
|---|---|---|---|---|---|---|---|
| Oct 1 | Carousel | 3,000 | 2,400 | 3,100 | 180 | 6.0% | 7.5% |
| Oct 4 | Reel | 3,010 | 5,200 | 6,000 | 210 | 7.0% | 4.0% |
| Oct 8 | Photo | 3,020 | 1,900 | 2,300 | 95 | 3.1% | 5.0% |
Formulas for row 2, with interactions in column F, followers in C, and reach in D: =F2/C2*100 and =F2/D2*100.
Record the followers on the day of the post instead of the profile's current number. If you recalculate old posts with today's count, any recent change in your audience rewrites the whole history.
What is a good engagement rate on Instagram?
There is no official number. Instagram does not publish engagement targets, and industry reports disagree because they use different formulas, samples, niches, and profile sizes. A study that divides only likes and comments by followers can't be compared with one that divides all interactions by reach.
That's why the most useful benchmark is your own baseline:
- average your last 10 to 20 posts in each format;
- compare every new post with that average, using the same formula;
- watch the trend over weeks, not a single post.
It's also normal for the follower-based rate to drop as an audience grows. Larger profiles tend to have a smaller share of followers interacting with each post. On its own, that doesn't mean the content got worse.
Does buying followers change your engagement rate?
It can, and the effect is purely mathematical. If the follower count goes up while interactions stay the same, the follower-based rate drops because the denominator got bigger.
| Scenario | Interactions | Followers | Rate by followers | Reach | Rate by reach |
|---|---|---|---|---|---|
| Before | 180 | 3,000 | 6.0% | 2,400 | 7.5% |
| Count +1,000, same interactions | 180 | 4,000 | 4.5% | 2,400 | 7.5% |
The reach-based rate doesn't change in this example because neither reach nor interactions changed. So anyone who changes their follower count by any means, whether a campaign, a giveaway, or a package, should track both rates and note the date of the change.
Followers added by a package come with no guarantee that they will like, comment on, or even see your next posts. Meta describes steps to remove inauthentic likes, follows, and comments, so the count can also fall later. Subio's international catalog lists 1,000 Instagram followers for $9.90, with checkout through Perfect Pay and no Instagram password requested. New international orders do not include free refills: they receive a single lower-drop delivery, and retention is not guaranteed. Before deciding, read the guide to the risks, prices, and limits of buying Instagram followers and the method for choosing how many followers to buy, which deals specifically with the denominator effect.
If the idea is to change the like count on a single post, the effect is different: the numerator goes up, but reach, saves, and shares don't follow. The guide to buying Instagram likes explains why that counter should be measured separately from the other metrics.
Engagement by followers, reach, or sales: which should you track?
Each metric answers a different question:
| Question | Most useful metric |
|---|---|
| How much of my visible audience reacts? | rate by followers |
| Does the content work for the people who see it? | rate by reach |
| Which Reel held attention best? | rate by views, retention |
| Does the content spark conversation or referrals? | comments, shares, and sends |
| Does the profile generate business? | link clicks, messages, orders |
For a business, engagement rate is an intermediate indicator. What pays the bills is leads and sales. The decision guide for Instagram stores shows how to keep follower count, visits, and orders apart.
If you use more than one platform, the guide to followers, likes, and views compares what each metric shows on Instagram, TikTok, and YouTube.
Common calculation mistakes
- Mixing formulas. Comparing your reach-based rate with another profile's follower-based rate.
- Using today's count for old posts. Your history shifts every time your audience changes.
- Counting only likes. Saves and shares usually signal stronger interest.
- Comparing different formats. Reels, carousels, and Stories don't behave the same way.
- Drawing conclusions from one post. A single outlier doesn't define the profile.
- Ignoring signs of suspicious accounts. An audience full of inactive accounts drags the rate down. The guide to real followers and bots explains which signs are only clues, and the guide on why you may be losing followers on Instagram covers how inactive-account cleanups affect the rate.
Frequently asked questions
How do you calculate Instagram engagement rate?
Add up a post's likes, comments, saves, and shares, divide the total by the number of followers or accounts reached, and multiply by 100. Example: 180 interactions on a profile with 3,000 followers equal 6%. Always write down which denominator you used.
What is a good engagement rate on Instagram?
There is no official number. Instagram does not publish a target, and industry studies use different formulas, samples, and niches. The most useful benchmark is your own profile's average across comparable posts, always measured with the same formula and over the same time window.
Is it better to calculate engagement by followers or by reach?
It depends on the question. The follower-based rate shows how much of the visible audience interacts and works for comparing public profiles. The reach-based rate shows how many viewers reacted, but it requires Insights access. Track both in separate columns without mixing them.
Does buying followers change your engagement rate?
It can. If the follower count rises while interactions stay the same, the follower-based rate falls. Example: 180 interactions over 3,000 followers give 6%; over 4,000 followers, they give 4.5%. The reach-based rate changes only if reach or interactions change.
Does Instagram Insights show a ready-made engagement rate?
Insights shows metrics such as views, accounts reached, accounts engaged, and interactions, but it does not display an official engagement rate as a percentage. The percentage is a calculation you make from those numbers. Third-party tools may use different formulas for the same indicator.
Should Stories and Reels go into the same engagement calculation as feed posts?
It is better to calculate them separately. Stories have replies and taps that do not exist in the feed, and Reels are usually judged by views. Mixing formats in one average can hide how each one performs. Give each format its own row or tab in your spreadsheet.
Sources and methodology
This content was prepared on October 31, 2026. The definitions of interactions, accounts engaged, accounts reached, and views were checked against Instagram's official help center and Meta's Insights API documentation. The formulas are industry conventions, not official Instagram metrics.
Every number in the examples and the spreadsheet is hypothetical, created to illustrate the calculation. No customer data was used. The cover illustration was generated by AI and does not depict a real person.
See the editorial policy and virtual-author disclosure. If, after measuring your baseline, you want to review package terms, check Subio's current prices and packages.
Before you buy
Review the price and order terms
Check the quantity, total amount, and refill terms before submitting a profile and paying.

Read also
Instagram shadowban: what it is, how to check, and what Instagram officially says

Instagram bio ideas: official limits, a structure that converts, and templates by profile type